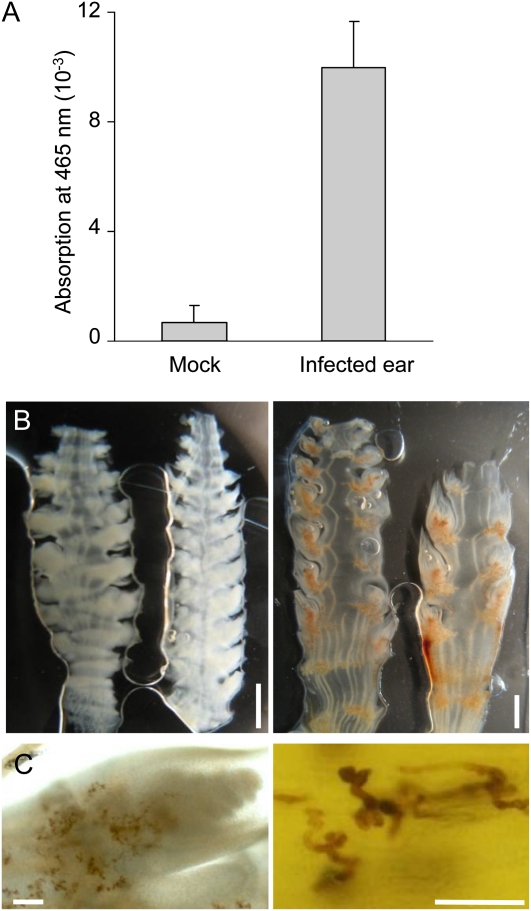
Figure 7.
Detection of ROS in healthy and S. reilianum-infected female inflorescences of maize cv Gaspe Flint. ROS were stained and visualized by exposure to DAB. A, DAB oxidization as a measure of ROS production in the supernatant of DAB-stained sections of female inflorescences. Error bars correspond to the sd of six independent measurements. B, Sections of healthy ears (left) and S. reilianum-colonized ears (right) after staining with DAB. Bar = 2 mm. C, ROS accumulation (brown area) in sections of an eary spikelet (left) and around fungal hyphae (right). Bars = 100 μm.

