Figure 3.
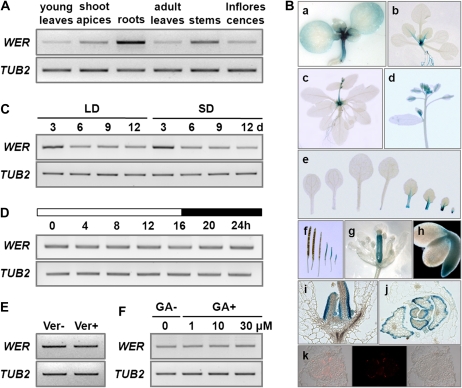
Expression of WER. A, RT-PCR analysis of WER in diverse tissue. RNAs of young leaves, shoot apices, and roots were isolated from 11-d-old Col seedlings grown in long days, while RNAs of rosette leaves, stems, and inflorescences were isolated from 28-d-old Col plants. TUB2 was used as a quantitative control. B, Spatial expression patterns of WER. a to i, GUS staining in WERp::GUS transgenic plants: a, 6-d-old seedling; b, 12-d-old plant; c, 22-d-old plant; d, an inflorescence with flowers; e, leaves obtained from a 12-d-old plant (the leaves are shown in order of production from cotyledon at left); f, siliques of different stages; g, a mature flower; h, a mature embryo; i, longitudinal section. j, Transverse section through the shoot apex of a 7-d-old seedling. k, MYC-WER protein expression in WERp::MYC-WER transgenic plants, with immunohistochemical data obtained from a 6-d-old seedling. C, Temporal expression of WER detected by RT-PCR analysis. RNA was isolated from the shoot of Col plants grown for 3, 6, 9, and 12 d in both long days and short days. TUB2 was used as a quantitative control. D, RT-PCR analysis of WER expression in Col plants during a 24-h cycle in long days. Shoot of 11-d-old seedlings was harvested every 4 h for RNA isolation. The zero time corresponds to right after dawn, and white or black boxes indicate light on or light off, respectively. TUB2 was used as a quantitative control. E, Comparison of WER expression in Col:FRISF2 grown for 11 d in long days with (Ver+) and without (Ver−) vernalization at 4°C for 8 weeks. TUB2 was used as a quantitative control. F, RT-PCR analysis of WER expression with (GA+) or without (GA−) exogenous GA3 treatment. TUB2 was used as a quantitative control. The whole seedling was used for RNA extraction.

