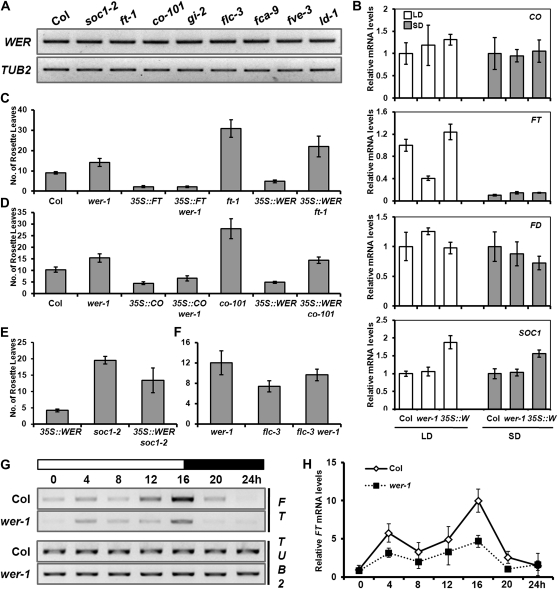
Figure 4.
Regulation of flowering-time genes by WER. A, RT-PCR analysis of WER expression in various flowering-time mutants. For RNA isolation, shoot of seedlings grown for 11 d under long days was harvested. TUB2 was used as a quantitative control. B, The expression of various flowering-time genes in Col, wer-1, and 35S::WER was detected by qRT-PCR. White bars show gene expression in plants grown for 9 d under long days (LD), while gray bars show gene expression in plants grown for 21 d under short days (SD). The values and error bars represent means and sd, respectively, from three technical replicates. C, Flowering time of Col, wer-1, 35S::FT, 35S::FT wer-1, 35S::WER, ft-1, and 35S::WER ft-1 grown in long days. D, Flowering time of Col, wer-1, 35S::CO, 35S::CO wer-1, co-101, 35S::WER, and 35S::WER co-101 grown in long days. E, Flowering time of 35S::WER, soc1-2, and 35S::WER soc1-2 grown in long days. F, Flowering time of wer-1, flc-3, and flc-3 wer-1 grown in long days. G and H, Daily rhythm of FT in Col and wer-1 plants grown under long days was detected by RT-PCR analysis (G) or calculated by ImageJ from three independent RT-PCR results (H). Nine-day-old seedlings grown under long-day conditions were harvested every 4 h for RNA isolation. The zero time corresponds to right after dawn, and white or black boxes indicate light on or light off, respectively.

