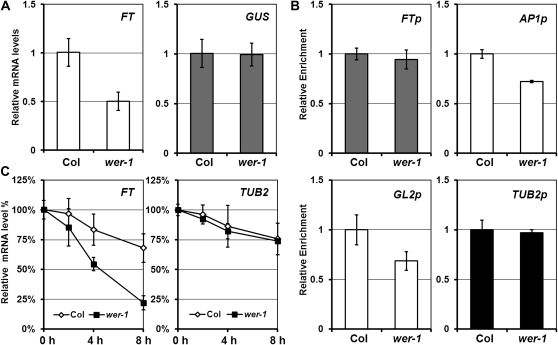
Figure 5.
Posttranscriptional regulation of FT mRNA. A, Expression levels of the GUS gene driven by the FT promoter and endogenous FT mRNA in FTp::GUS Col (Col) and FTp::GUS wer-1 (wer-1) plants detected by qRT-PCR. The values and error bars represent means and sd, respectively, from three technical replicates. B, ChIP assay with RNA polymerase II antibody. Enrichment in each promoter was confirmed by ChIP-qPCR analysis. Values are normalized against Col, and means of triplicate experiments are presented with error bars representing sd. C, RNA was isolated from 7-d-old Col and wer-1 grown in continuous light (24 h of light) after 200 μm actinomycin D treatment for 0, 2, 4, or 8 h. Expression of FT and TUB2 in each sample was detected by RT-qPCR, and values are normalized against the expression level of untreated sample (0 h). Mean values from three technical replicates are shown with error bars representing sd.

