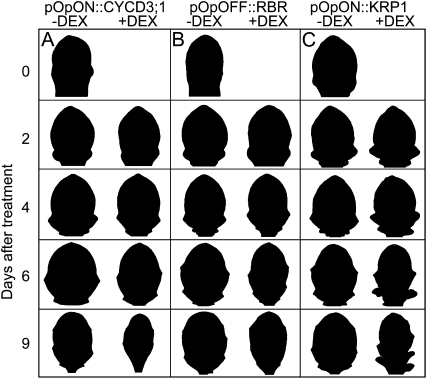
Figure 4.
Spatial-temporal changes in leaf shape after induction of cell cycle genes. Silhouettes of leaf 6 from pOpON::CYCD3;1 (A), pOpOFF::RBR (B), and pOpON::KRP1 (C) plants during normal growth (−DEX) or at time points after induction (+DEX). Silhouettes have been normalized for size to facilitate shape comparison.

