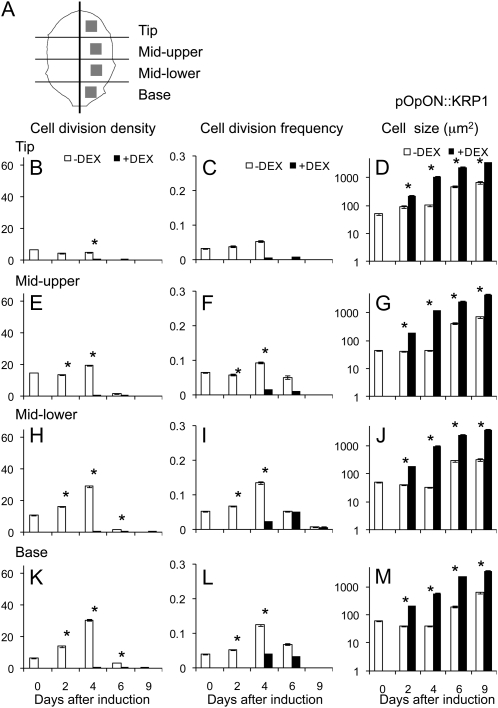
Figure 7.
Spatial-temporal changes in cell division density, frequency, and size in the epidermis after induction of leaf 6 of pOpON::KRP1 plants. A, Schematic showing the regions of leaf 6 from which cell division data were collected. Cell division density (divisions/area; B, E, H, and K), cell division frequency (divisions/number of cells; C, F, I, and L), and cell size (D, G, J, and M) were calculated in the epidermis of pOpON::KRP1 leaves either induced (+DEX, black bars) or not induced (−DEX, white bars) from day 10. Data were analyzed in regions of the tip (B–D), mid-upper (E–G), mid-lower (H–J), and base (K–M) of the leaf at different time points (days after induction). Mean values with se are shown (n > 30 from at least five independent leaves for each data point). Pairwise comparisons showing significant difference at a confidence limit of at least 0.05 are indicated with an asterisk.

