Figure 1.
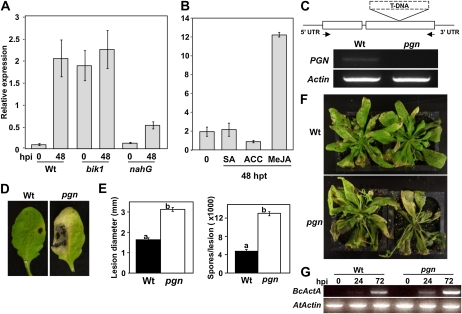
Expression of the PGN gene and characterization of the pgn mutant for disease resistance. A and B, Expression of PGN in response to B. cinerea (A) and exogenous application of plant hormones (B). C, Genomic organization of the pgn T-DNA insertion and loss of PGN expression (arrows indicate primer locations used to assay expression). D and E, Disease symptoms (D), lesion diameter (E), and number of spores per lesion 4 d after inoculation with A. brassicicola. F and G, Disease symptoms (F) and B. cinerea ActinA (G; BcActA) accumulation as a measure of fungal growth following spray inoculation with B. cinerea. Images were taken 5 (D) and 7 d after inoculation (F). Inoculation and quantification of disease symptoms/fungal growth were performed as described in “Materials and Methods.” Data for lesion diameters and spores/lesion represent the mean ± se from a minimum of 20 inoculated leaves. hpi, Hours postinoculation; hpt, hours posttreatment; UTR, untranslated region; Wt, wild type. Experiments were repeated at least three times with similar results.

