Figure 4.
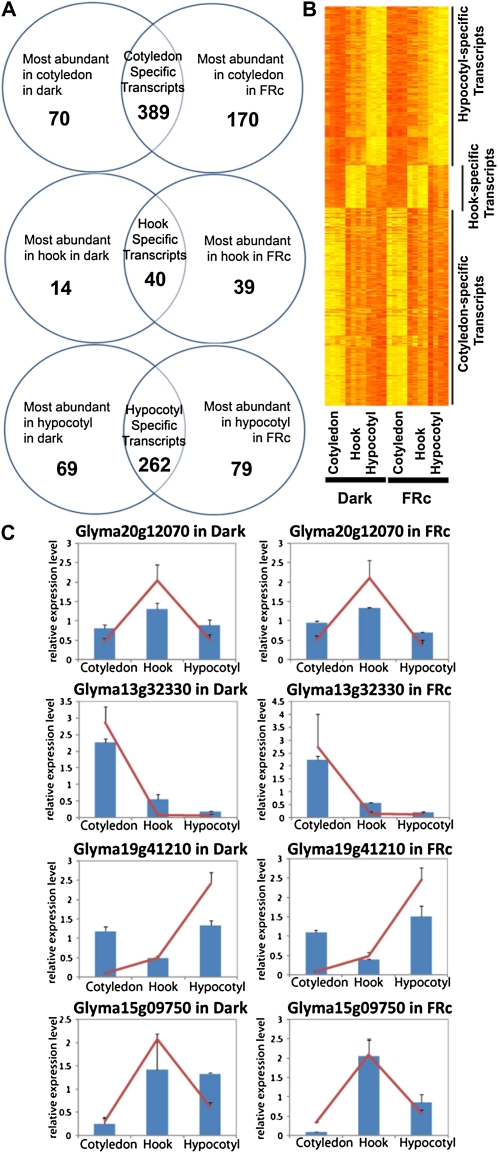
Identification and QRT-PCR confirmation of organ-specific transcripts. A, Organ-specific transcripts in dark-grown etiolated seedlings and seedlings treated with 1 h of FRc were identified by microarray using a single-channel approach and the rank product method. The intersection of these two groups represents the transcripts that are consistently organ specific in this experiment, used hereafter as the organ-specific gene lists. B, Heat map showing normalized expression values of organ-specific genes across three organs in two different light conditions with four biological replicates per organ per light condition. Yellow indicates high expression, while orange indicates low expression. C, Confirmation of organ-specific expression by QRT-PCR. In each graph, the relative expression levels (normalized to the mean expression level in all three organs) derived from the microarray (red lines) and QRT-PCR data (blue columns) were plotted for cotyledon, hook, and hypocotyl. The error bars represent se of all biological replicates.

