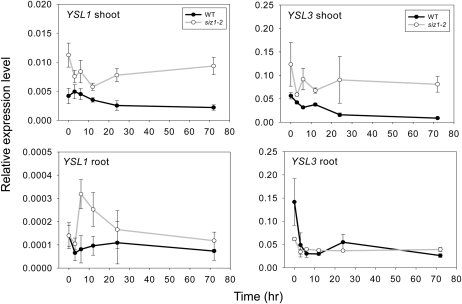
Figure 6.
Time-course expression profiles of YSL1 and YSL3 in shoot and root tissues. Twelve-day-old wild-type (WT) and siz1-2 plants were treated with half-strength MS medium or half-strength MS medium containing 25 μm CuSO4 for 3, 6, 12, 24, and 74 h. Transcript levels of YSL1 and YSL3 were determined by qPCR analysis. The y axis values represent expression relative to ACT2. Means and error bars were calculated from six samples of two biological repeats.

