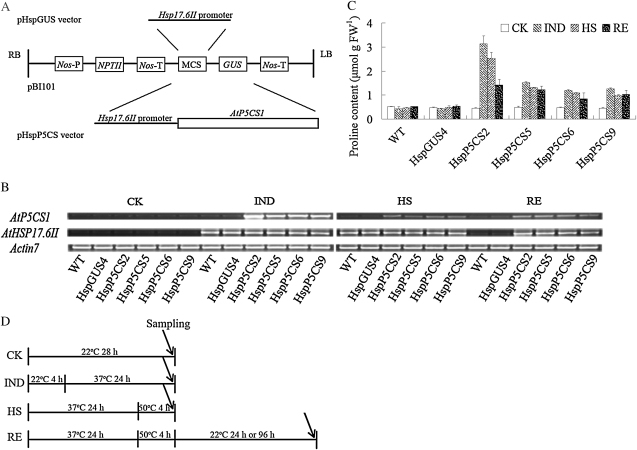
Figure 1.
Construction of plasmid vectors, the mRNA expression of AtP5CS1, and determination of free Pro content. A, Schematic presentation of vectors pHspGUS and pHspP5CS. LB, Left border; RB, right border. B, Expression level of AtP5CS1 in wild-type (WT), HspGUS4, and transgenic lines, as determined by semiquantitative RT-PCR. C, Measurement of free Pro content in all stages. FW, Fresh weight. D, Schematic drawing of the experimental design for HS. CK, Control; IND, Pro induction at 37°C for 24 h; HS, heat stress at 50°C for 4 h after Pro induction; RE, recovery from HS. For semiquantitative RT-PCR analysis and Pro accumulation measurements, seedlings were recovered for 24 h. The IND and HS treatments started after 8 h of light, with the same photoperiods and light conditions as for the control. Results were calculated from measurements of at least three repeats.

