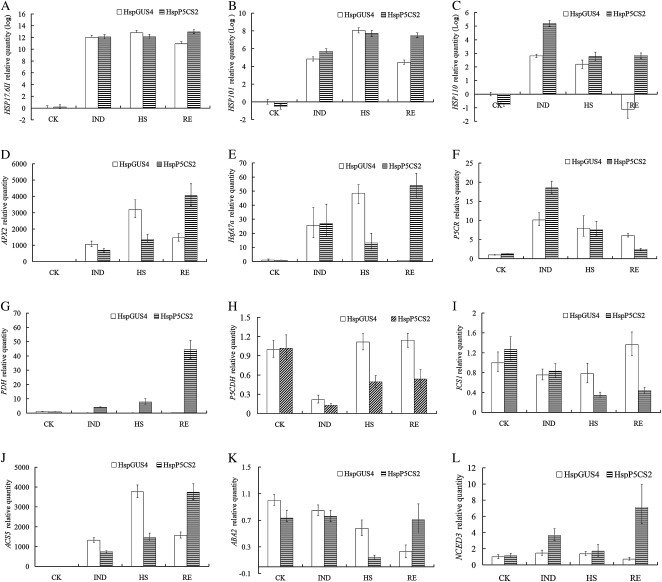
Figure 5.
Analysis of gene expression by real-time PCR. Fold change of expression levels of genes (HSP17.6II, HSP101, HSP110, APX2, HsfA7a, P5CR, PDH, P5CDH, ICS1, ACS5, ABA2, and NCED3) was detected by quantitative real-time PCR. The raw data (cycle threshold values) were normalized using ACTIN2 as an internal reference, of which the results of HSPs were log2 transformed. Data are means ± se of at least three independent experiments. This is a representation of at least two replicates. CK, Control.

