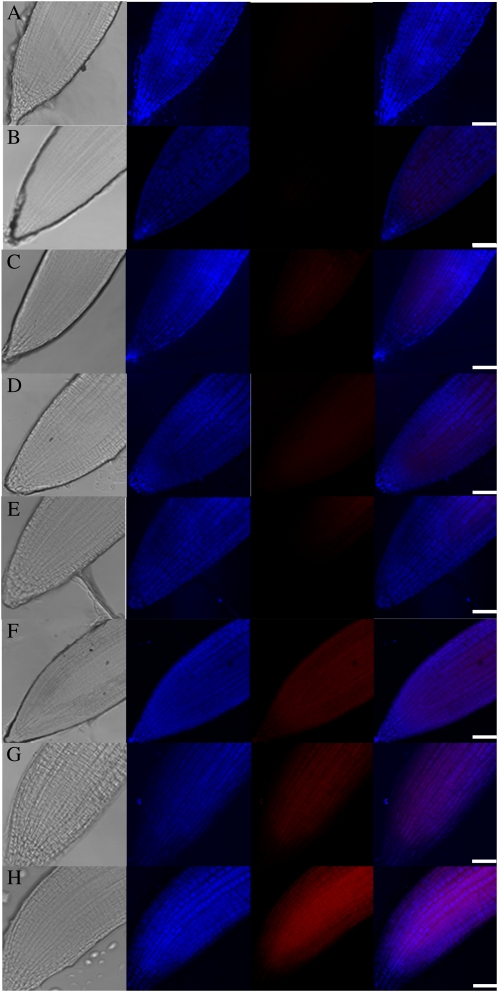
Figure 6.
Mitochondrial O2− generation in roots of HspGUS4 and HspP5CS2 seedlings during HS. Columns from left to right are as follows: light image, mitochondria localization in blue pseudocolor stained with MitoTracker-Deep Red, O2− generation in red pseudocolor stained with MitoSox-Red, and the merged fluorescence. Staining was performed with lines HspGUS (A, C, E, and G) and HspP5CS (B, D, F, and H) during control conditions (A and B), the Pro-inducing period (C and D), and the recovery stage after heat treatment at 50°C without (E and F) or with (G and H) exogenous Pro pretreatment. Bars = 50 μm.

