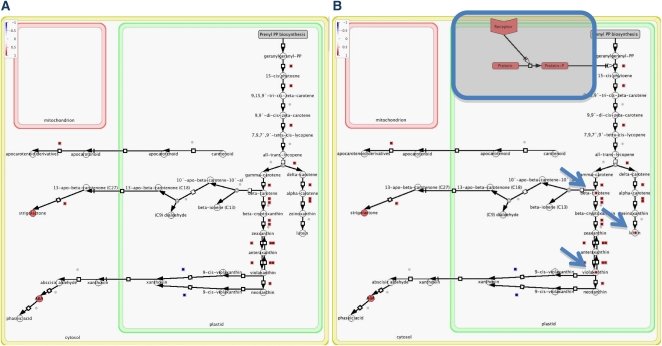
Figure 2.
Example of data visualization on pathway images and customization of pathway images. A, Visualization of gene expression data (supplemental table II in Peschke and Kretsch, 2011; list of genes that exhibit significantly altered transcript levels at 4 h under continuous far-red light; induced +1, repressed −1) on pathway image “Carotenoid_Apocarotenoid_ABA_biosynthesis_and_catabolism.jpg” using MapMan tool and attached “Mapping_File.txt.” B, The same pathway image customized by the Cell Designer tool to add elements of a putative regulatory pathway (in frame). Additionally, images can be customized to express other gene expression data, as exemplified by visualizing metabolites (arrows). This type of customization requires annotation of other pathway elements than structural genes with the ImageAnnotator tool in MapMan and updating a mapping file (Mapping File.xls) with these new annotated elements.

