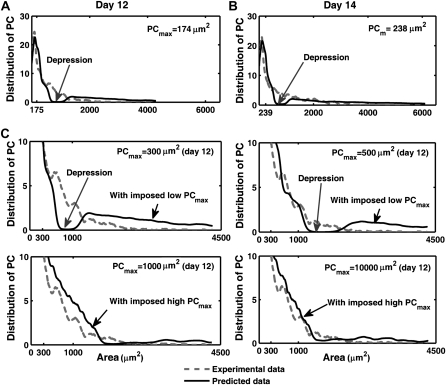
Figure 5.
Observed and predicted pavement cell size distribution with optimized and imposed PCmax values. A and B, Comparison between the experimental and predicted pavement cell size distribution with optimized PCmax for day 12 (A) and day 14 (B). C, Comparison for different imposed values of PCmax at day 12. PC, Pavement cells.

