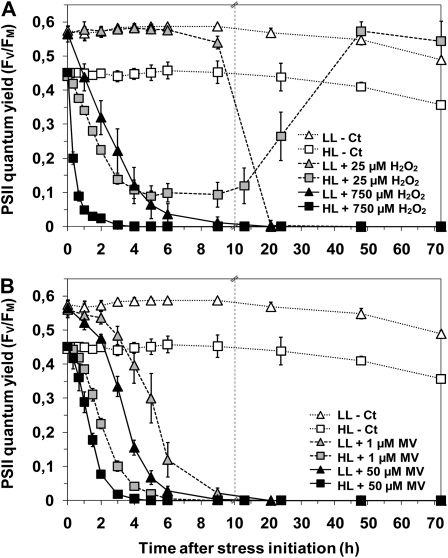
Figure 2.
PSII activity in response to H2O2 (A) and MV (B). The time course of changes in Fv/Fm of Synechococcus sp. WH7803 cells acclimated to LL (triangles) or HL (squares) was measured after the addition of 25 μm (gray symbols) or 750 μm (black symbols) H2O2 and 1 μm (gray symbols) or 50 μm (black symbols) MV. Control cultures without stress induction are indicated by white symbols. Broken vertical lines indicate changes of time scale on the x axis. These data are based on three to five independent experiments and are expressed as means ± sd.

