Figure 3.
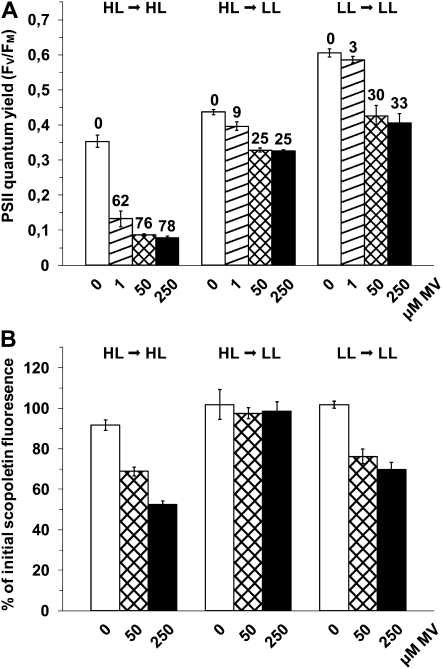
Effect of photosynthetic electron transport on the MV-mediated photoinhibition and H2O2 production. A, Fv/Fm was measured 2 h after the addition of 0, 1, 50, and 250 μm MV (white, dashed, crossed, and dark bars, respectively) to Synechococcus sp. WH7803 cells acclimated to HL and maintained in HL (HL → HL), acclimated to HL but shifted to LL 10 min before the stress initiation (HL → LL), or acclimated to LL and maintained under LL (LL → LL). The percentage of photoinactivation of stressed cells compared with untreated cells for the same light treatment is indicated above the bars. B, Scopoletin fluorescence was measured 0.5 h after the addition of MV in the same conditions as in A. The decrease of fluorescence, relative to its initial value, is due to the scopoletin degradation by H2O2 from the cells. All these data are based on three independent experiments and are expressed as means ± sd.

