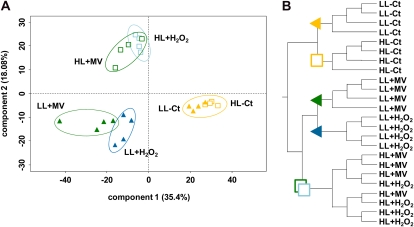
Figure 6.
Multivariate analyses of microarray data. PCA was performed (A) and hierarchical clustering dendrograms were drawn (B) using the R Stats package on a subset identified as significantly differentially expressed (FDR ≤ 0.05) in at least one of the pairwise comparisons. Experiments with LL- and HL-acclimated cells are indicated by colored triangles and white squares, respectively. Treatments using 25 μm H2O2, 750 μm H2O2, and 50 μm MV are indicated by light blue, dark blue, and dark green symbols, respectively. Nontreated controls are in orange. In PCA, each replicate is indicated by one symbol, and percentages of variability accounted for by the two main components are shown near the axes.

