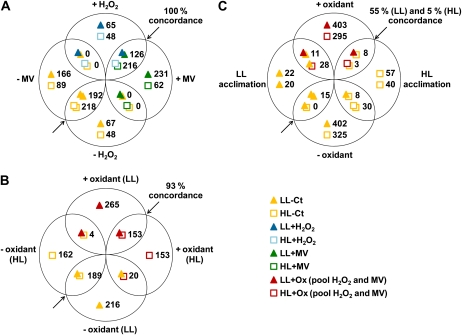
Figure 7.
Pairwise comparisons of microarray data sets. Venn diagrams were created with genes showing a statistically significant (FDR ≤ 0.05; see “Materials and Methods”) differential expression in response to the different treatments. The number of genes differentially expressed in each data set is indicated near its representing symbol (see bottom right). The percentage concordance is related to genes that were significantly differentially expressed between the two compared conditions (represented by overlapping symbols) and that are additionally regulated in the same way (up- or down-regulation) in both conditions. A, Comparison of the transcriptomic responses to H2O2 and MV treatments for both LL- and HL-acclimated cells. B, Comparison of the pooled responses to oxidative stress (+/− oxidizing agent; i.e. genes responding to H2O2 and/or MV) between LL- and HL-acclimated cells. C, Comparison of the pooled responses to oxidative stress (+/− reactive oxygen stressors) in LL (top signs/values) and HL (bottom signs/values) cells and of the genes differentially expressed in HL- compared with LL-acclimated conditions. Concordant and discordant genes (i.e. common genes regulated in opposite ways between two conditions) from this diagram are listed in Table I.

