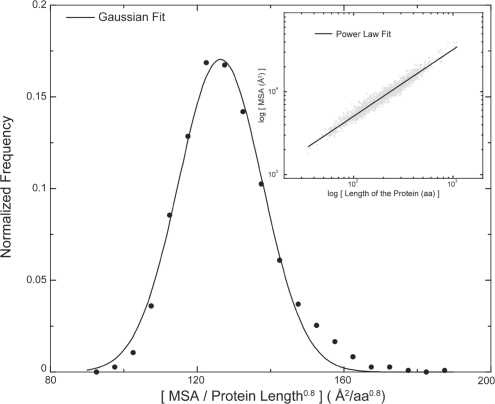
Fig. 1.
Scaling of MSA as a function of protein size. MSA scales with size of the protein as (length)0.8. Upon normalization of MSA by (length)0.8, MSA from all structures fits to a Gaussian distribution. The raw plot of MSA versus the protein length is shown as gray points and the power-law fit is shown as a black line (inset).

