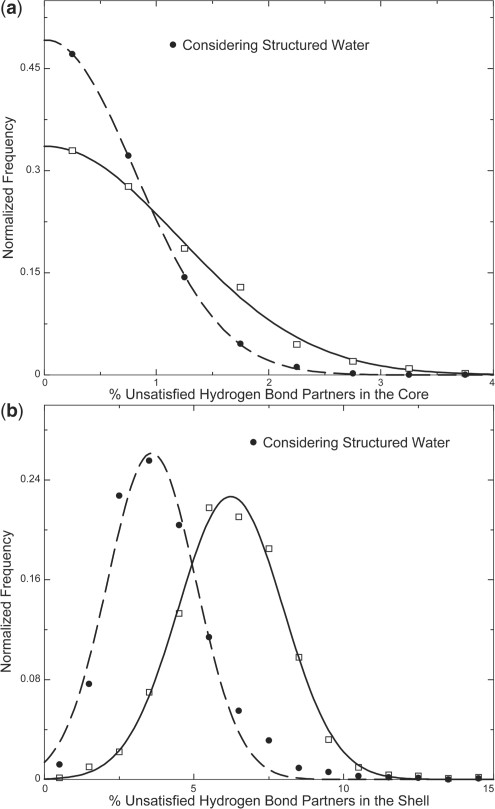
Fig. 3.
Distribution of the percentage of unsatisfied hydrogen bond partners. The distribution of unsatisfied hydrogen bond partners that are completely buried is plotted with open squares, with the corresponding Gaussian fit shown as a solid line (a). The percentage decreases when hydrogen bonds with buried structural waters are considered (solid circles, Gaussian fit is plotted as dashed lines) (a). Similar plots for hydrogen-bonding partners in the shell region of a protein (b).

