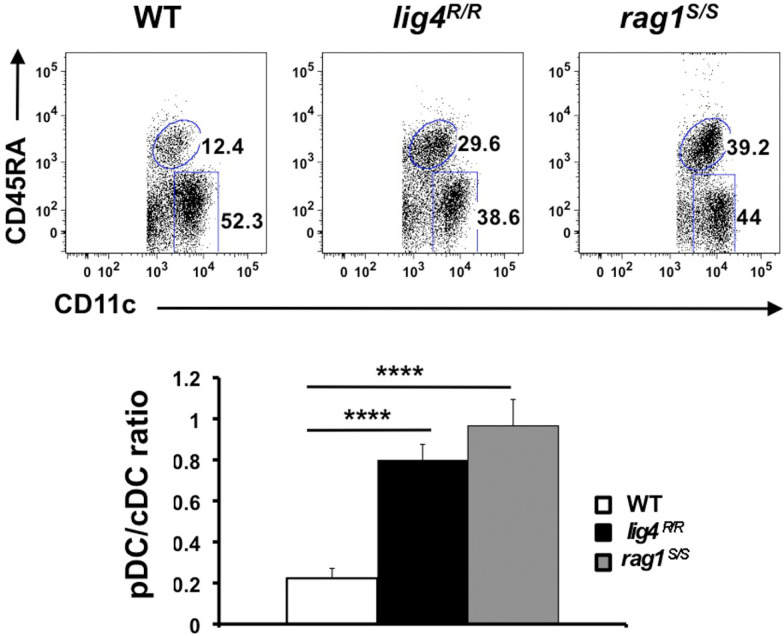
Figure 7.
Altered distribution of thymic DCs populations in lig4R/R and rag1S/S thymuses. Top panels: FACS dot plot analysis of the distribution of CD11c+ CD45RA− cDCs and CD11cint CD45RAhi pDCs in the thymus of WT, lig4R/R, and rag1S/S mice after gating on a population of stromal cells positive for CD11c expression but negative for a cocktail of biotinylated markers specific for markers of T and B lymphocytes, erythroid, granulocyte, and macrophage lineages. Lower panels: Proportion of thymic cDCs and pDCs in WT, lig4R/R, and rag1S/S mice. Mean values ± SE are shown. At least six mice per group were analyzed.

