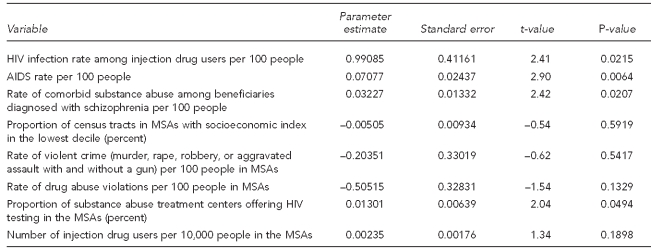
Table 3.
Sensitivity analysesa with transformed dependent variableb in a study of community rates of treated prevalence of HIV infection among adult Medicaid beneficiaries diagnosed with schizophrenia in 44 MSAs, 2002–2003
aAdjusted R-squared = 0.7914
bDependent variable is log(p/(1–p)), where p represents HIV prevalence as rate, potentially ranging between 0 and 1.
HIV = human immunodeficiency virus
MSA = metropolitan statistical area
AIDS = acquired immunodeficiency syndrome

