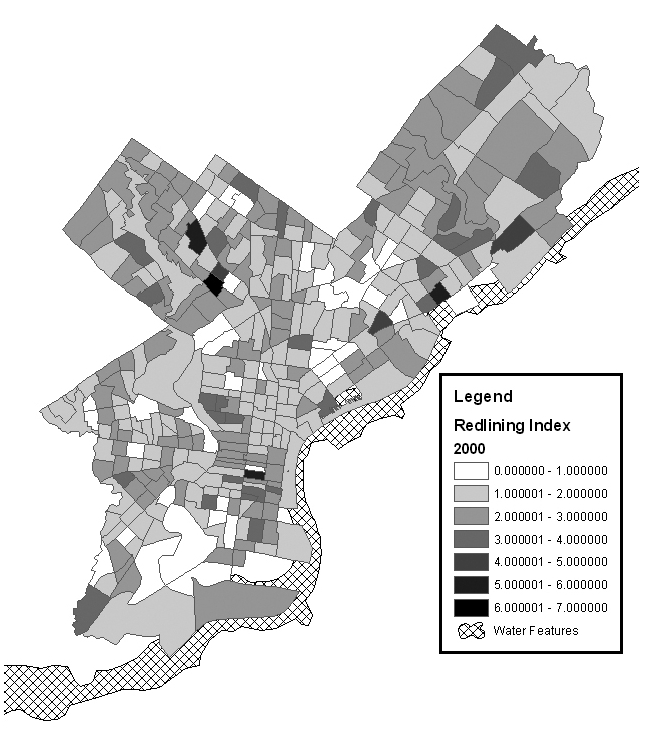
Figure 2.
Map of residential redlining in Philadelphia County, Pennsylvania: HMDA data, 2000a
aThis figure shows a map of the level/amount of residential redlining for each census tract in Philadelphia County in 2000. The redlining indices are calculated as the odds ratios for the black-white difference in mortgage loan denials after controlling for income, loan amount, type of loan, and gender of applicant. The HMDA data were used to calculate the redlining indices.
HMDA = Home Mortgage Disclosure Act