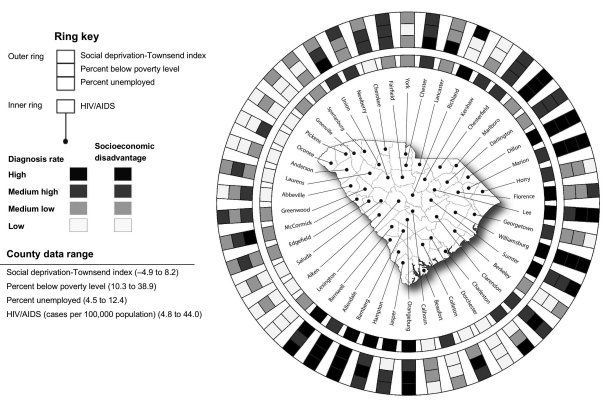
Figure 3.
Diagnosis rate of HIV/AIDS and levels of socioeconomic disadvantagea in South Carolina by countyb,c, using a ring map spatial visualization methodd
aThree socioeconomic disadvantage measures are represented: Townsend index of social deprivation, percent below poverty level, and percent unemployed.
bDiagnosis rate and socioeconomic disadvantage rankings are based on county rate distribution quartiles.
cData sources: Census Bureau (US). Small area income and poverty estimates, county data, 2006–2008 [cited 2010 Apr 9]. Available from: http://www.census.gov/did/www/saipe; Census Bureau (US). Census 2000: summary file 3 [cited 2010 Apr 9]. Available from: URL: http://www.census.gov/main/www/cen2000.html; Bureau of Labor Statistics (US). Local area unemployment statistics, county data, 2006–2008 [cited 2010 Apr 9]. Available from: URL: http://www.bls.gov/lau/home.htm, 2006-2008; South Carolina Department of Environmental Control, 2006–2008
dRing map available in a color presentation at http://ifs.sc.edu/PRMM/RingMaps
HIV = human immunodeficiency virus
AIDS = acquired immunodeficiency syndrome

