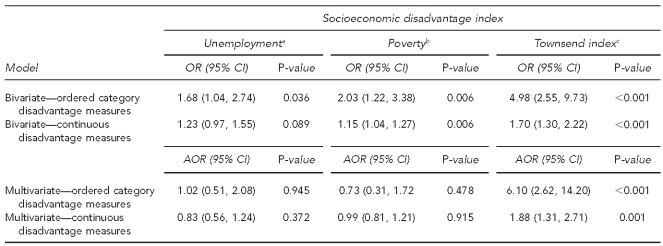
Table 1.
County-level association between HIV/AIDS diagnosis rate categories (quartiles) and socioeconomic disadvantage in South Carolina, 2006–2008
aPercent of the civilian labor force that is unemployed
bPercent of the population for whom poverty status is determined to be living below the federal poverty level
cThe Townsend index is a composite measure based on four component indicators—unemployment (percent of the civilian labor force without jobs), vehicle access (percent of households with no vehicle available), household tenure (percent of households that rent rather than own a home), and household crowding (percent of households with more than one person per room). Social deprivation scores for South Carolina counties were calculated by deriving standardized z-scores based on each of the four component index distributions and by summing the resulting z-scores for each county.
HIV = human immunodeficiency virus
AIDS = acquired immunodeficiency syndrome
OR = odds ratio
CI = confidence interval
AOR = adjusted odds ratio

