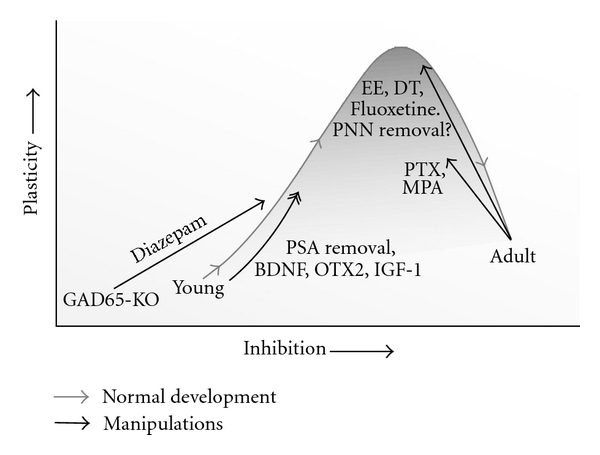
Figure 1.

Relationship of inhibition and plasticity during the critical period. Gray line depicts maturation of inhibition and the increase and decline of potential for plasticity during normal development. Black lines show experimental manipulations by which the level of plasticity or inhibition has been artificially altered. EE is environmental enrichment, DT is dark treatment, PNN is perioneuronal net. All manipulations are infusions or injections of substances, except for BDNF which has been overexpressed. See text for references.
