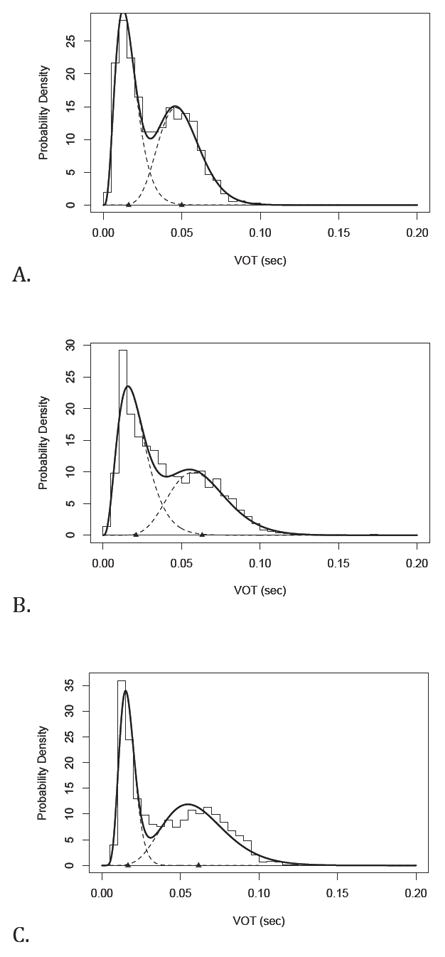
Figure 4.

Illustration of gamma mixture models for the best (a) median (b) and worst fit (c) participants. The bars represent the empirical distribution of participant VOTs. The solid line is the fitted cumulative distribution produced by combining the voiced and voiceless distributions. The individual sound category distributions are shown by dashed lines; triangles indicating the mean of each category.
