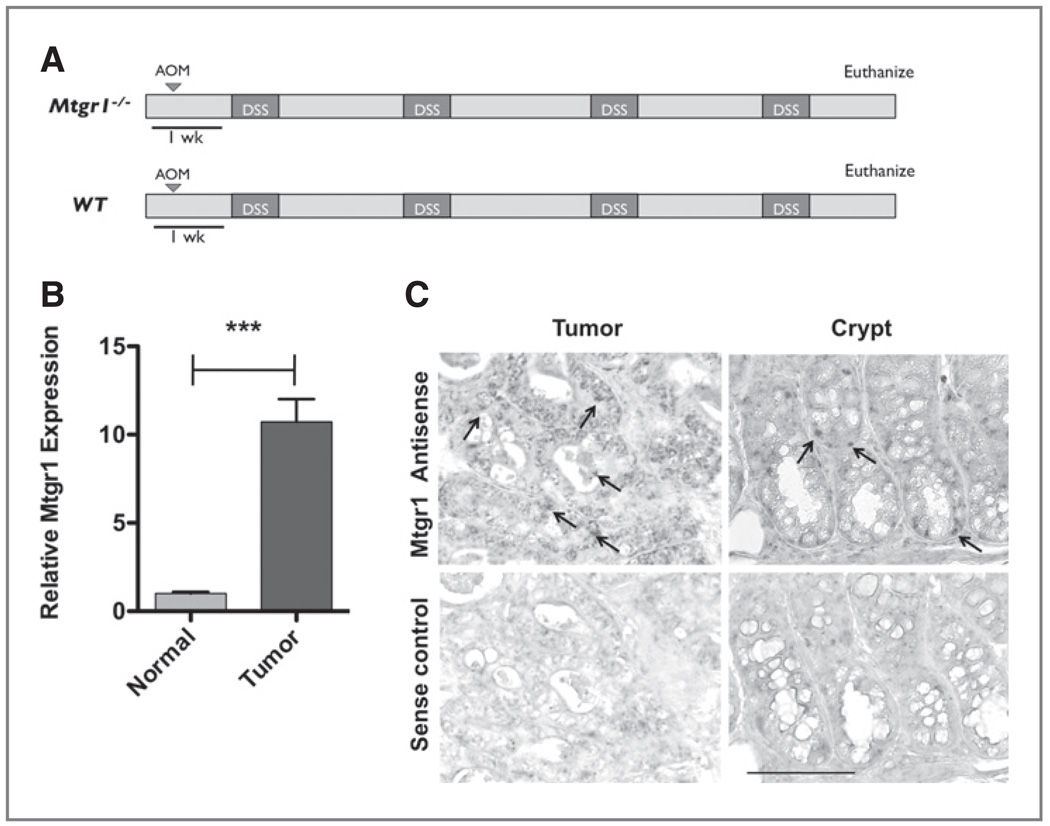
Figure 1.
Mtgr1 expression is increased in tumors resulting from AOM/DSS colitis-associated carcinoma. A, schematic of the AOM/DSS protocol. B, polyps and adjacent normal tissue subjected to Taqman qRT-PCR analysis via the delta–delta CT method that demonstrated a 10.73-fold increase in Mtgr1 expression in tumor versus normal tissue (***P < 0.001). Error bar represents the standard error for four biological replicates performed in triplicate. C, Mtgr1 in situ hybridization of colonic "Swiss Rolls" obtained from WT AOM/DSS. Arrows indicate positive signal within the base of the crypt. Scale bar is 5 µm.

