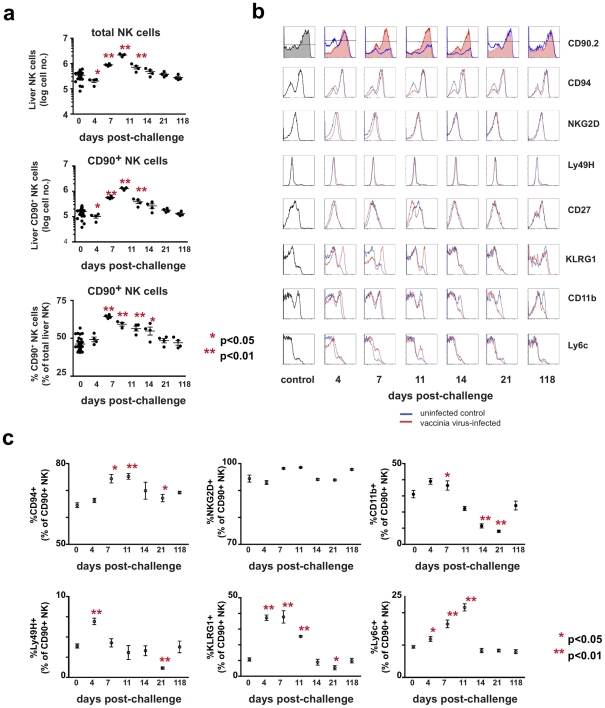
Figure 4. Kinetic and phenotypic analysis of liver NK cell responses following primary vaccinia virus infection reveals the preferential expansion of a Thy1+ population.
Mice were administered either PBS (control) or 1×10⁷ pfu of rVV (challenged) ip. At various time points following challenge, cells were isolated from the enzymatically-dissociated livers of control and challenged mice. (a) The absolute number of NK cells (CD3−NK1.1+), the absolute number of Thy1+ NK cells (CD3− NK1.1+ Thy1+), and the percentage of total NK cells that were Thy1+ are shown. Each data point represents an individual mouse, with the mean indicated by the horizontal bar and error bars representing the SEM. Absolute liver NK cell numbers were calculated by multiplying the total number of viable cells within the lymphocyte gate of each sample (as determined by analysis on a Guava easyCyte instrument) by the percentage of those cells determined to be CD3−NK1.1+ by flow cytometric analysis. The representation of Thy1+ cells within the total NK cell population, both as a percentage and an absolute number, was also determined based on flow cytometric analysis and the cell counts obtained by Guava analysis. Statistical analyses were performed using t tests and Mann-Whitney analysis comparing the various time points to that of the naïve control group. Statistically significant differences between virally-infected groups post-challenge and the uninfected control group are indicated by one (p<0.05) or two (p<0.01) asterisks. (b) Further phenotypic characterization of Thy1+ liver NK cells following vaccinia virus infection is shown in a series of histograms. The red traces represent cells from challenged mice and the blue traces represent cells from control mice isolated at the same time point and stained with the same antibody cocktail. (c) Quantitative analyses of the phenotypic profiles of Thy1(CD90)+ NK cells (cells within the CD3−NK1.1+CD90.2+ gate) stained with antibodies to the indicated molecules as determined by flow cytometric analysis. Statistical analyses were performed using t tests and Mann-Whitney analysis comparing the various time points to that of the naïve control group. Statistically significant differences between virally-infected groups post-challenge and the uninfected control group are indicated by one (p<0.05) or two (p<0.01) asterisks.

