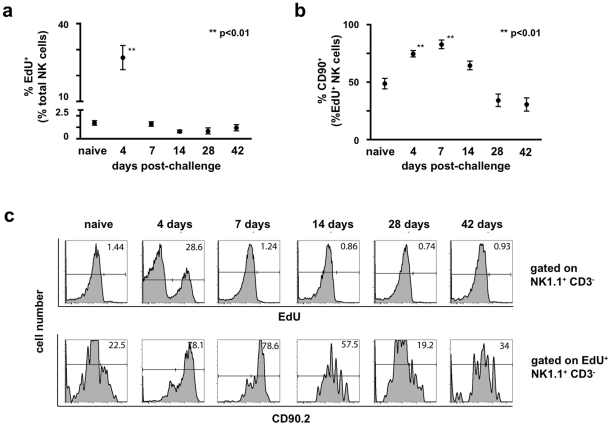
Figure 5. Expansion of the NK cell population post-challenge is driven by proliferation in situ.
Groups of B6 mice were either infected with 1×10⁷ pfu rVV ip or given a control injection of PBS. The thymidine analog 5-ethynyl-2′-deoxyuridine (EdU) was administered ip 12 hours prior to sacrifice (250 μg EdU/animal). Cell suspensions isolated from liver were stained with monoclonal antibodies to CD3, NK1.1, and Thy1 (CD90.2), fixed, permeabilized, and treated with the Click-IT EdU staining buffer with Alexa 647 azide to detect EdU incorporation. (a) The percentage of liver NK cells (CD3−NK1.1+) that incorporated EdU is plotted over time. Statistical analyses were performed using t tests and Mann-Whitney analysis comparing the various time points to that of the naïve control group. Statistically significant differences between virally-infected groups post-challenge and the uninfected control group are indicated by one (p<0.05) or two (p<0.01) asterisks. (b) The percentage of EdU+ liver NK cells expressing Thy1 (CD90.2) is plotted over time. Statistical analyses were performed using t tests and Mann-Whitney analysis comparing the various time points to that of the naïve control group. Statistically significant differences between virally-infected groups post-challenge and the uninfected control group are indicated by one (p<0.05) or two (p<0.01) asterisks. (c) Representative histograms measuring EdU incorporation by total liver NK cells is shown in the top panel, while representative histograms measuring Thy1 (CD90.2) expression by cells within the corresponding EdU+ gate are represented in the lower panel. These results are representative of two independent experimental replicates.

