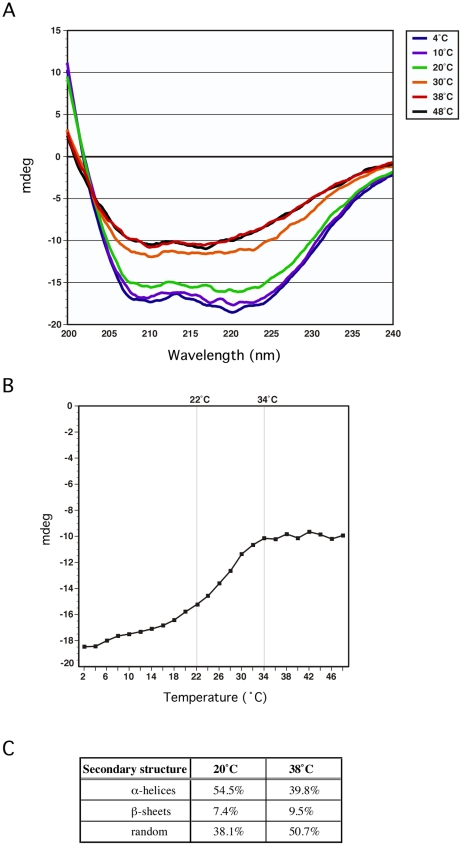
Figure 6. GmaR undergoes a temperature-dependent conformational change.
(A) Circular Dichroism (CD) spectral analysis of 5 µM GmaR measured from 200 nm to 240 nm on a Jasco J-815 spectrometer at increasing temperatures (4°C, 10°C, 20°C, 30°C, 38°C and 48°C). (B) CD analysis of 5 µM GmaR at 220 nm over a temperature range of 2°C to 48°C with a temperature slope of 1°C/min. (C) Predicted secondary structure analysis of GmaR at both 20°C and 38°C estimated using the K2D2 algorithm [45].

