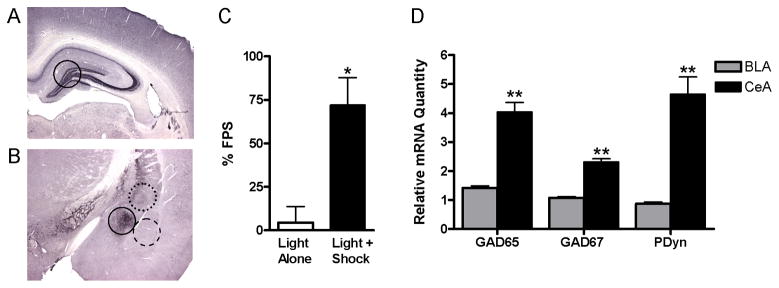
Figure 1. Control data for quantitative PCR analysis of gene expression.
(A and B) Micrographs of coronal rat brain sections showing prodynorphin immunoreactivity (methods in the Supplement) and the approximate location and size of bilateral tissue punches (1mm3) taken from (A) the hippocampus (solid-line) and (B) the central nucleus of the amygdala (CeA, solid-line), basolateral nucleus of the amygdala (BLA, dashed-line), and striatum (STR, dotted-line). (C) Rats that received Light+Shock training (n=12) showed increased fear-potentiated startle (FPS) compared to those that received Light Alone training (n=6) (mean ± S.E.M.; Student’s t test). (D) Levels of glutamic acid decarboxylase 65 and 67 kDa (GAD65, GAD67) and prodynorphin (PDyn) were higher in tissue punches taken from the CeA compared to the BLA (n=20; mean ± S.E.M.; Mann-Whitney tests). *P<0.05 vs. Light Alone (C), **P<0.01 vs. BLA tissue punches (D).

