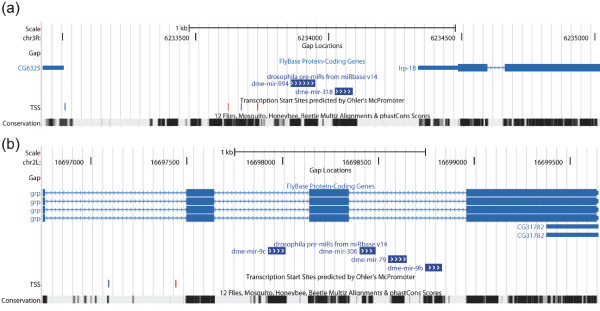
Figure 2.
TSSs of 994~318 and 9c~9b clusters. (a) Two putative TSSs of the 994~318 cluster with coordinated expression profile. (b) One putative TSS of the intronic 9c~9b cluster with uncoordinated expression profile. Red and blue ticks are TSSs in sense and antisense orientations, receptively. The maps were produced in the UCSC Genome Browser [40].

