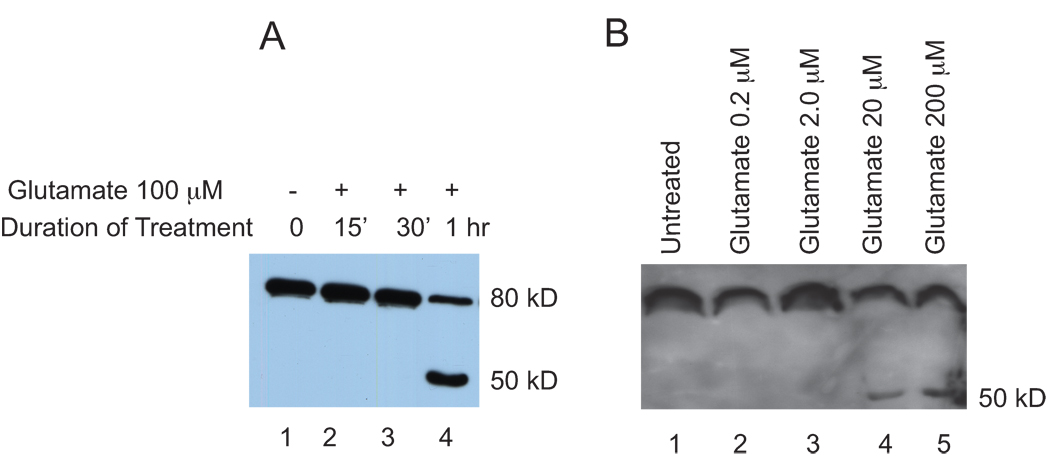
Figure 2. Kinetics and dosage dependent curve of ADAR2 cleavage upon glutamate treatment.
A. Cortical neurons 10 d.i.v expressing Flag-ADAR2 were treated with 100µM glutamate for time points 0 min, 15 min, 30 min and 1hr. Nuclear extracts were subjected to western blotting with anti-Flag antibody. B. Cortical neurons expressing Flag-ADAR2 were either not treated (lane 1) treated with glutamate at 0.2µM (lane 2), 2µM (lane 3), 20µM (lane 4) and 200µM (lane5).

