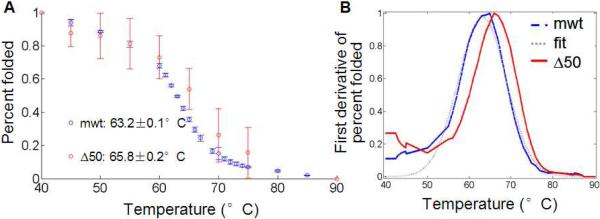
Figure 4. Thermal denaturation of Δ50 LA and mwt LA protein by measuring tryptophan fluorescence.
(A) Fluorescence of maximum tryptophan signal are normalized to signals corresponding to 100% folded (measured at 37°C) and 0% folded (at 95°C). The averages of two independent runs are shown of each protein. (B) To find the transition melting temperature, we take the first derivative of the signal. Interpolation, smoothing and fit to a Gaussian curve (see Figure S6) allow us to determine transition temperatures with confidence intervals (Table 3).

