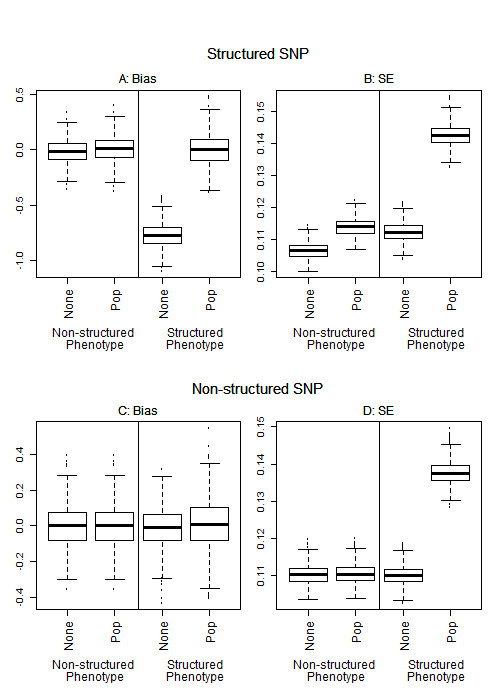
Figure 3.

Bias and standard error (SE). Two sub-populations of 500 individuals each, Fst = 0.01, simulated log additive odds ratio of 1.2. Bias was computed as the estimated effect minus the true simulated beta. For the non-structured phenotype, each sub-population had a population prevalence of disease of 0.1. For the structured phenotype the population prevalence of disease was 0.16 in sub-population 1 and 0.04 in sub-population 2. The non-structured SNP had a frequency of 0.2 in each population, and the structured SNP had a frequency of 0.1 in sub-population 1 and 0.3 in sub-population 2. None indicates no PCs were adjusted for in the model and Pop indicates that the known population was adjusted for in the model.
