Figure 6.
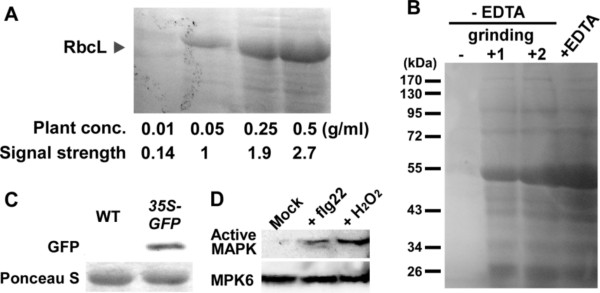
Compatibility of the chemical cell lysis method for protein analyses. Protein samples were prepared by the procedure shown in Figure 5 unless otherwise stated. (A) SDS-PAGE analysis of proteins extracted by the chemical method. Arabidopsis seedlings were boiled in the lysis solution at the indicated concentrations (Plant conc.). The arrowhead indicates the position of Rubisco large subunit (RbcL). Signal intensities of RbcL are shown as relative values (Signal strength). (B) Comparison of the chemical method with usual grinding methods. For +EDTA, 50 mg leaves of 3-week-old Arabidopsis were boiled in 100 μl of the lysis solution as shown in Figure 5. For - EDTA, grinding +1, 50 mg leaves were ground with a pestle homogenizer in 100 μl of 2× Laemmli sample buffer and boiled. For - EDTA, grinding +2, 50 mg leaves were frozen in liquid nitrogen, ground to powder using a mortar and pestle, and boiled in 100 μl of 2× Laemmli sample buffer. For - EDTA, grinding -, 50 mg unground leaves were boiled in 2× Laemmli sample buffer. (C) Immunoblot analysis of GFP. Samples were prepared from wild-type plants (WT) and transgenic plants expressing GFP under the control of the CaMV35S promoter (35S-GFP). Proteins on the membrane were stained with Ponceau S to ensure equal protein loading (bands of RbcL are shown). (D) Immunoblot analysis of flg22- or H2O2-induced MAPK activation. Seedlings were treated with 1 μM flg22 (+ flg22) or 40 mM H2O2 (+ H2O2) and subjected to the immunoblot analysis.

