
Figure 7.
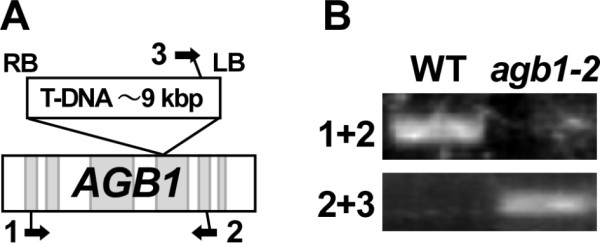
Compatibility of the chemical method for genomic DNA analysis. (A) Diagram of T-DNA insertion in AGB1. Exons are shown as light gray boxes. Arrows 1, 2 and 3 represent AGB1 forward primer, AGB1 reverse primer and T-DNA left border primer, respectively. RB: right border; LB: left border. (B) PCR templates were prepared by the procedure shown in Figure5 from wild-type (WT) and agb1-2 mutant plants. Primer pairs used for PCR are shown as 1+2 and 2+3 (the numbers correspond to those in panel A).