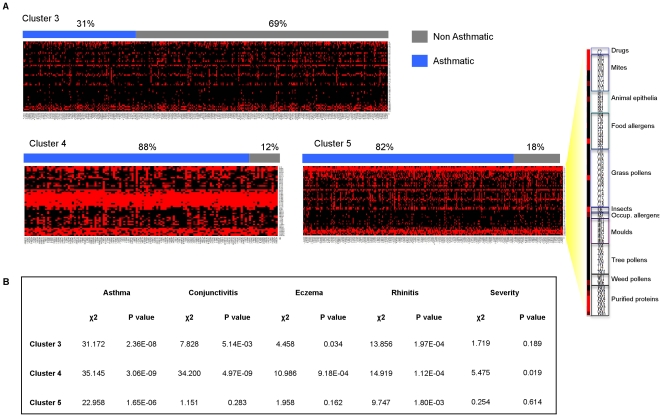
Figure 2. K-means clustering of serum reactivity profiles of 827 sera (columns) against the subset of asthma relevant allergens (rows).
(A) The serum reactivity profile generated for each cluster (3–5) at k = 3 are visualized. Each column represents an individual serum grouped as asthmatic (blue) and non-asthmatic (gray). Reactivity values to individual allergens are classified as either positive (scale of red - class score 1–5) and negative (black - class score 0). (B) The distribution of atopic conditions in each cluster was assessed using the Pearson's X 2 test.

