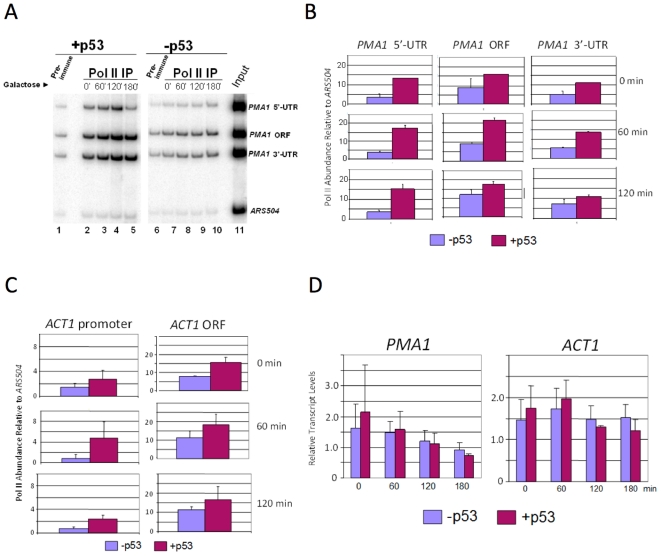
Figure 4. p53 Increases Pol II Density at Constitutively Transcribed Genes.
(A) Pol II ChIP analysis of the PMA1 gene in p53+ and p53− cells. Depicted is a multiplex PCR analysis (resolved on an 8% polyacrylamide gel) of DNA purified from immunoprecipitated chromatin samples isolated from SY1000 (PGAL1- p53) and SLY101 (p53−) cells subjected to a 2% galactose induction for 0, 60, 120 and 180 min. Immunoprecipitations were conducted using pre-immune (lanes 1, 6) or anti-CTD antiserum (lane 2–5, 7–10). Lane 11, DNA isolated from chromatin used in the ChIPs of lanes 1 and 2. An ORF-free region on chromosome V (ARS504) was co-amplified with the PMA1 loci, and serves as a non-specific IP control. (B) Summary of Pol II ChIP assays of the PMA1 5′-UTR, ORF, and 3′-UTR in p53+ and p53− cells conducted as in panel A. Depicted is Pol II abundance at each locus (net signal, immune minus pre-immune) relative to ARS504 (net signal, immune minus pre-immune). Shown are means ± S.D; N = 2. (C) As in panel B, except Pol II ChIP analysis of the ACT1 gene. (D) Northern analysis of PMA1 and ACT1 in p53+ and p53− cells following addition of galactose for the indicated times. Transcript levels were normalized to those of SCR1 and are presented in arbitrary units (shown are means ±S.D; N = 2).

