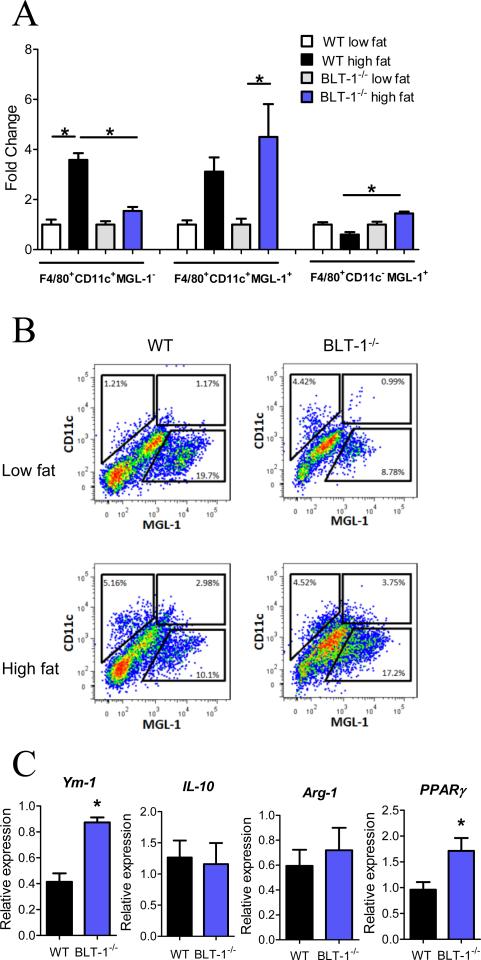
Figure 4. BLT-1 deficiency alters adipose tissue macrophage phenotypes.
(A) Quantification of isolated adipose tissue macrophage populations in WT and BLT-1-deficient mice. (B) Representative flow cytometry dot plots of F4/80+ adipose tissue macrophages from WT or BLT-1-deficient mice. (C) Adipose tissue mRNA expression of characteristic alternatively activated adipose tissue macrophage genes. Data are presented as mean ± SEM; *P<0.05 by one-way ANOVA (A) or Student's t-test (C), n=6-9/group.

