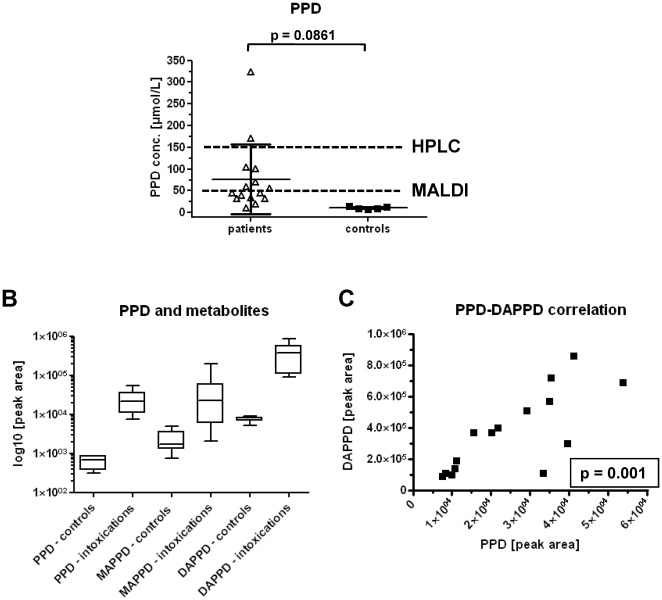
Figure 5. MALDI-MS/MS measurements of urine samples from patients with suspected PPD intoxication and controls.
(A) Measured PPD concentrations in clinical urine samples (n = 15); dotted lines show the LLOQ of the MALDI-MS/MS and the HPLC-UV application, resp. (B) Box-and-whisker blot with the 5–95 percentiles for the comparison of PPD, MAPPD and DAPPD peak areas in drug free control urine (n = 5) and clinical samples of intoxication (n = 15). (C) Data correlation (r2 = 0.7618) of PPD and DAPPD in patient urine (n = 15). Respective p-values are given in the graphs.

