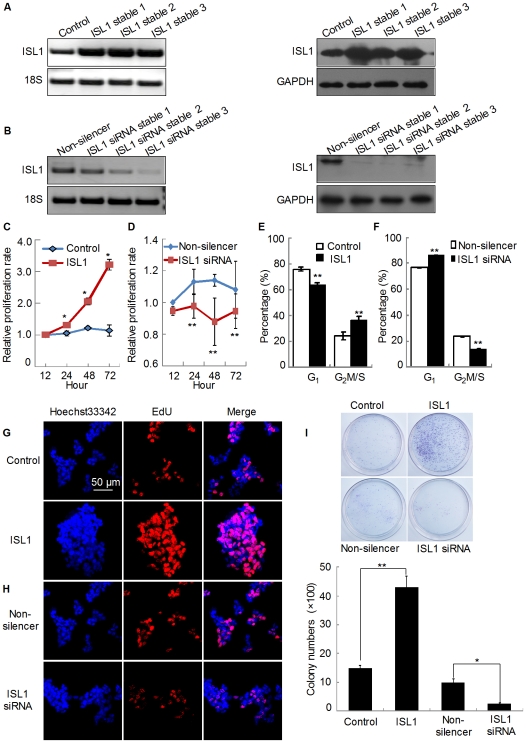
Figure 4. ISL1 promoted proliferation of HIT-T15 cells.
The expression of ISL1 in stable overexpression (A) or knockdown (B) HIT-T15 cell lines was examined by RT-PCR and Western blotting. The cell proliferation was determined by CCK-8 analysis. A total of 1×10³ cells (either stably overexpressing (C) ISL1 or stably knockdown (D) ISL1) per well were seeded in 96-well plate and measured for their proliferation after 12 h, 24 h, 48 h, and 72 h. The data represent 3 independent experiments, each performed in triplicate. Each bar represents mean ± SD (**p<0.01, *p<0.05, vs. the control). The cell cycle profile was analyzed by flow cytometry in ISL1 (E) and ISL1-siRNA (F) stable HIT-T15 cell lines. EdU incorporation was detected by confocal microscopy (scale bar, 50 µm) in ISL1 (G) and ISL1-siRNA (H) stable cells. (I) Stable cells were maintained in G418 or puromycin-containing medium for 21 days before staining with crystal violet and counting for colony numbers. Each bar represents mean ± SD from 3 samples (**p<0.01, *p<0.05, vs. the control).

