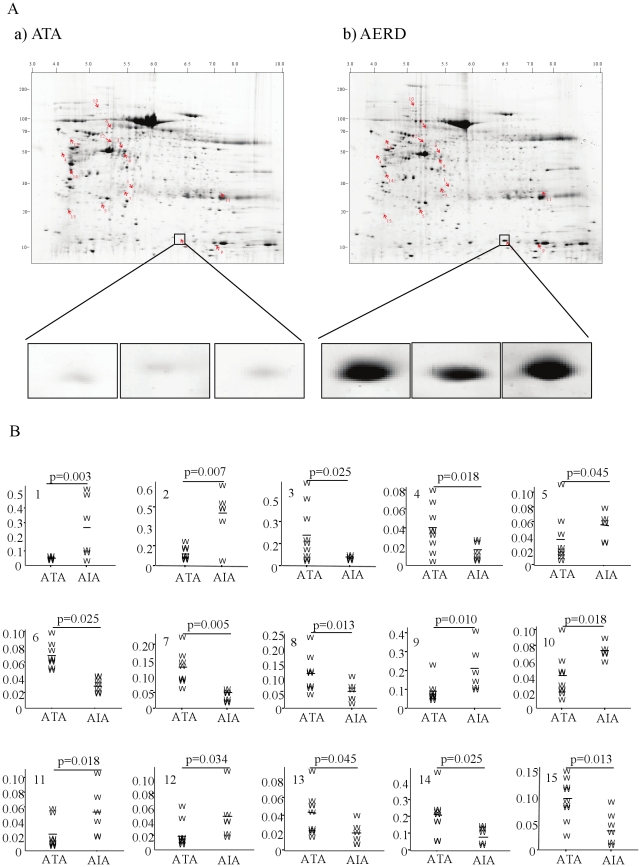
Figure 1. Photographs of two-dimensional electrophoresis (2-DE) separation of nasal polyps proteins obtained from ATA (n = 8) and subjects with AERD (n = 5).
(A) one ATA, and one patient with AERD. Nasal polyp proteins (1 mg) were focused on a pH 3–10 immobilized pH gradient strip and then separated by 7.5–20% gradient SDS-PAGE and visualized as described in the Methods. Protein spots identified by LC-MS (arrows) are labeled with numbers. Spot #2 is enlarged in small boxes. (B) The Y-axis of each graph represents the relative intensity of the spot (%). P-values represent the difference between the ATA and AERD samples.

