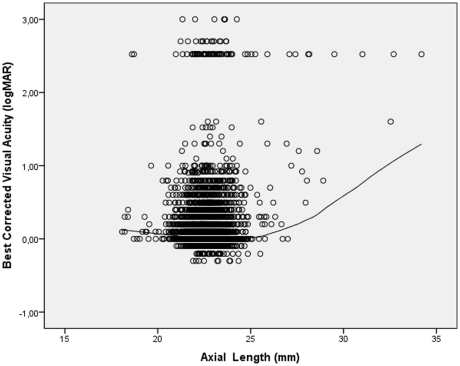
Figure 3. Scattergram showing the correlation between best corrected visual acuity (expressed as the logarithm of the minimal angle of resolution, logMAR) and axial length in the Central India Eye and Medical Study; the regression line was calculated using a locally weighted scatterplot smoothing (LOWESS) function.
The subgroup of cases in the logMAR range >2.0 is explained by the shift from visual acuity from a level measurable by chart to a visual acuity at the counting fingers level and below.

