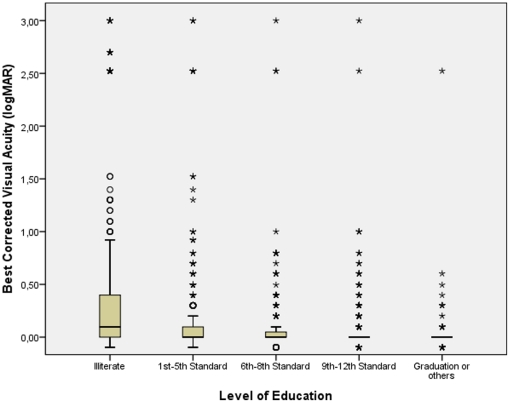
Figure 5. Scattergram showing the correlation between best corrected visual acuity and the level of education in the Central India Eye and Medical Study.
The box contains the middle half of the study population, with the median (black horizontal line in the box) indicating the numerical value separating the higher half of the whole study population from its lower half. The end of the whiskers superior and inferior to each box represent the highest and lowest, respectively, value within a range of 1.5 times of the box length. The black dots represent the outliers which by definition are located between 1.5 to 3 times the box lengths (interquartile range) outside of the box. The asterisks represent extremes which by definition are located more than 3 times the box length (interquartile range) outside of the box. The subgroup of cases in the logMAR range >2.0 is explained by the shift from visual acuity from a level measurable by chart to a visual acuity at the counting fingers level and below.

