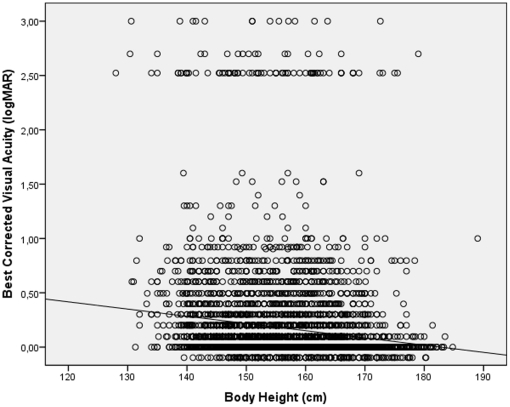
Figure 6. Scattergram showing the correlation between best corrected visual acuity and body height in the Central India Eye and Medical Study.
The subgroup of cases in the logMAR range >2.0 is explained by the shift from visual acuity from a level measurable by chart to a visual acuity at the counting fingers level and below.

