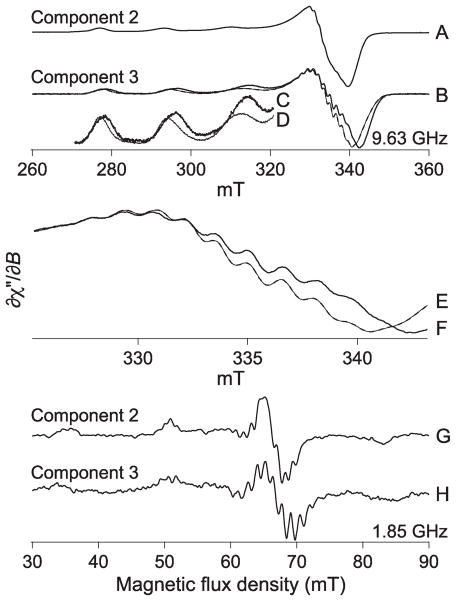
Figure 1.
Experimental EPR spectra of 63Cu(II)–PrPf2 components 2 and 3. Traces A and B are the X-band EPR spectra of components 2 and 3, respectively. Trace B is shown expanded in amplitude over the g|| region (C, D) and in field range over the g⊥ region (E, F) and corresponds to a sample prepared by rapid freeze–quench at p2H 6.0 (C, F) and a sample prepared manually at p2H 6.5 (D, E). Traces G and H are the L-band EPR spectra of components 2 and 3, respectively.

