Figure 3.
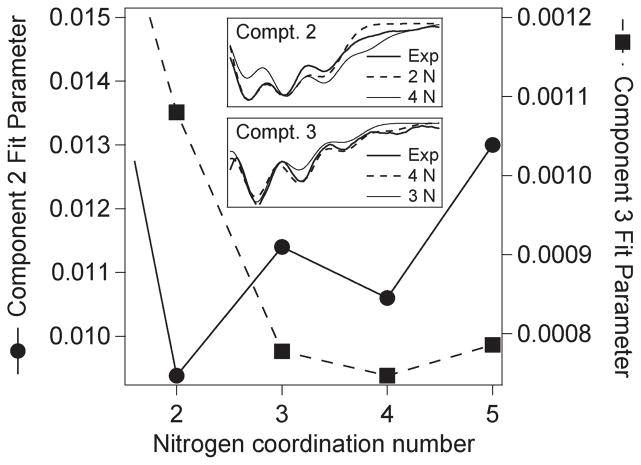
Least-squares fit parameters for simulations of 63Cu-(II)–PrPf2 components 2 and 3 L-band EPR spectra. Fit parameters from XSophe for simulations of the ∂2χ″/∂B2 L-band EPR spectra for components 2 (—, ●; left axis) and 3 (---, ■; right axis) are shown in the main panel. The fit parameter is a least-squares measure of the difference between experimental and calculated spectra; a lower fit parameter indicates a better fit. The fit parameter includes no compensation for noise in the experimental spectra or other experimental parameters (e.g., instrument gain) and is, therefore, a useful indicator of the quality of the fit to a given spectrum but does not allow meaningful comparison of fits to different spectra. The insets show the fits in the ∂χ″/∂B display (the actual fitting was carried out with the ∂2χ″/∂B2 spectra), with the assumption of selected nitrogen coordination numbers, to omponents 2 (top) and 3 (bottom) over the EA regions of the spectra that are highly sensitive to nitrogen coordination number.

