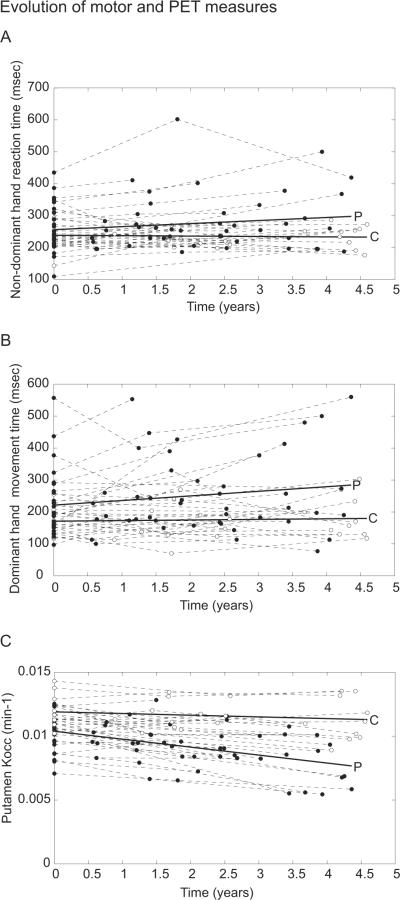
Figure 1. Evolution of motor and PET measures.
Non-dominant hand reaction time (A), dominant hand movement time (B), and mean putamen FDOPA Kocc (C) for PD patients (filled circles, regression line indicated by P) and control subjects (unfilled circles, regression line indicated by C) are plotted against timing of visits over the study interval. Within-subject measurements are connected by dashed lines. The time effect is of greatest significance for putamen Kocc (t [df] =-8.7 [104], P<10−13) in contrast to motor measures (t [df] >1.8 [104], P< 0.04).

